Your listening workbook
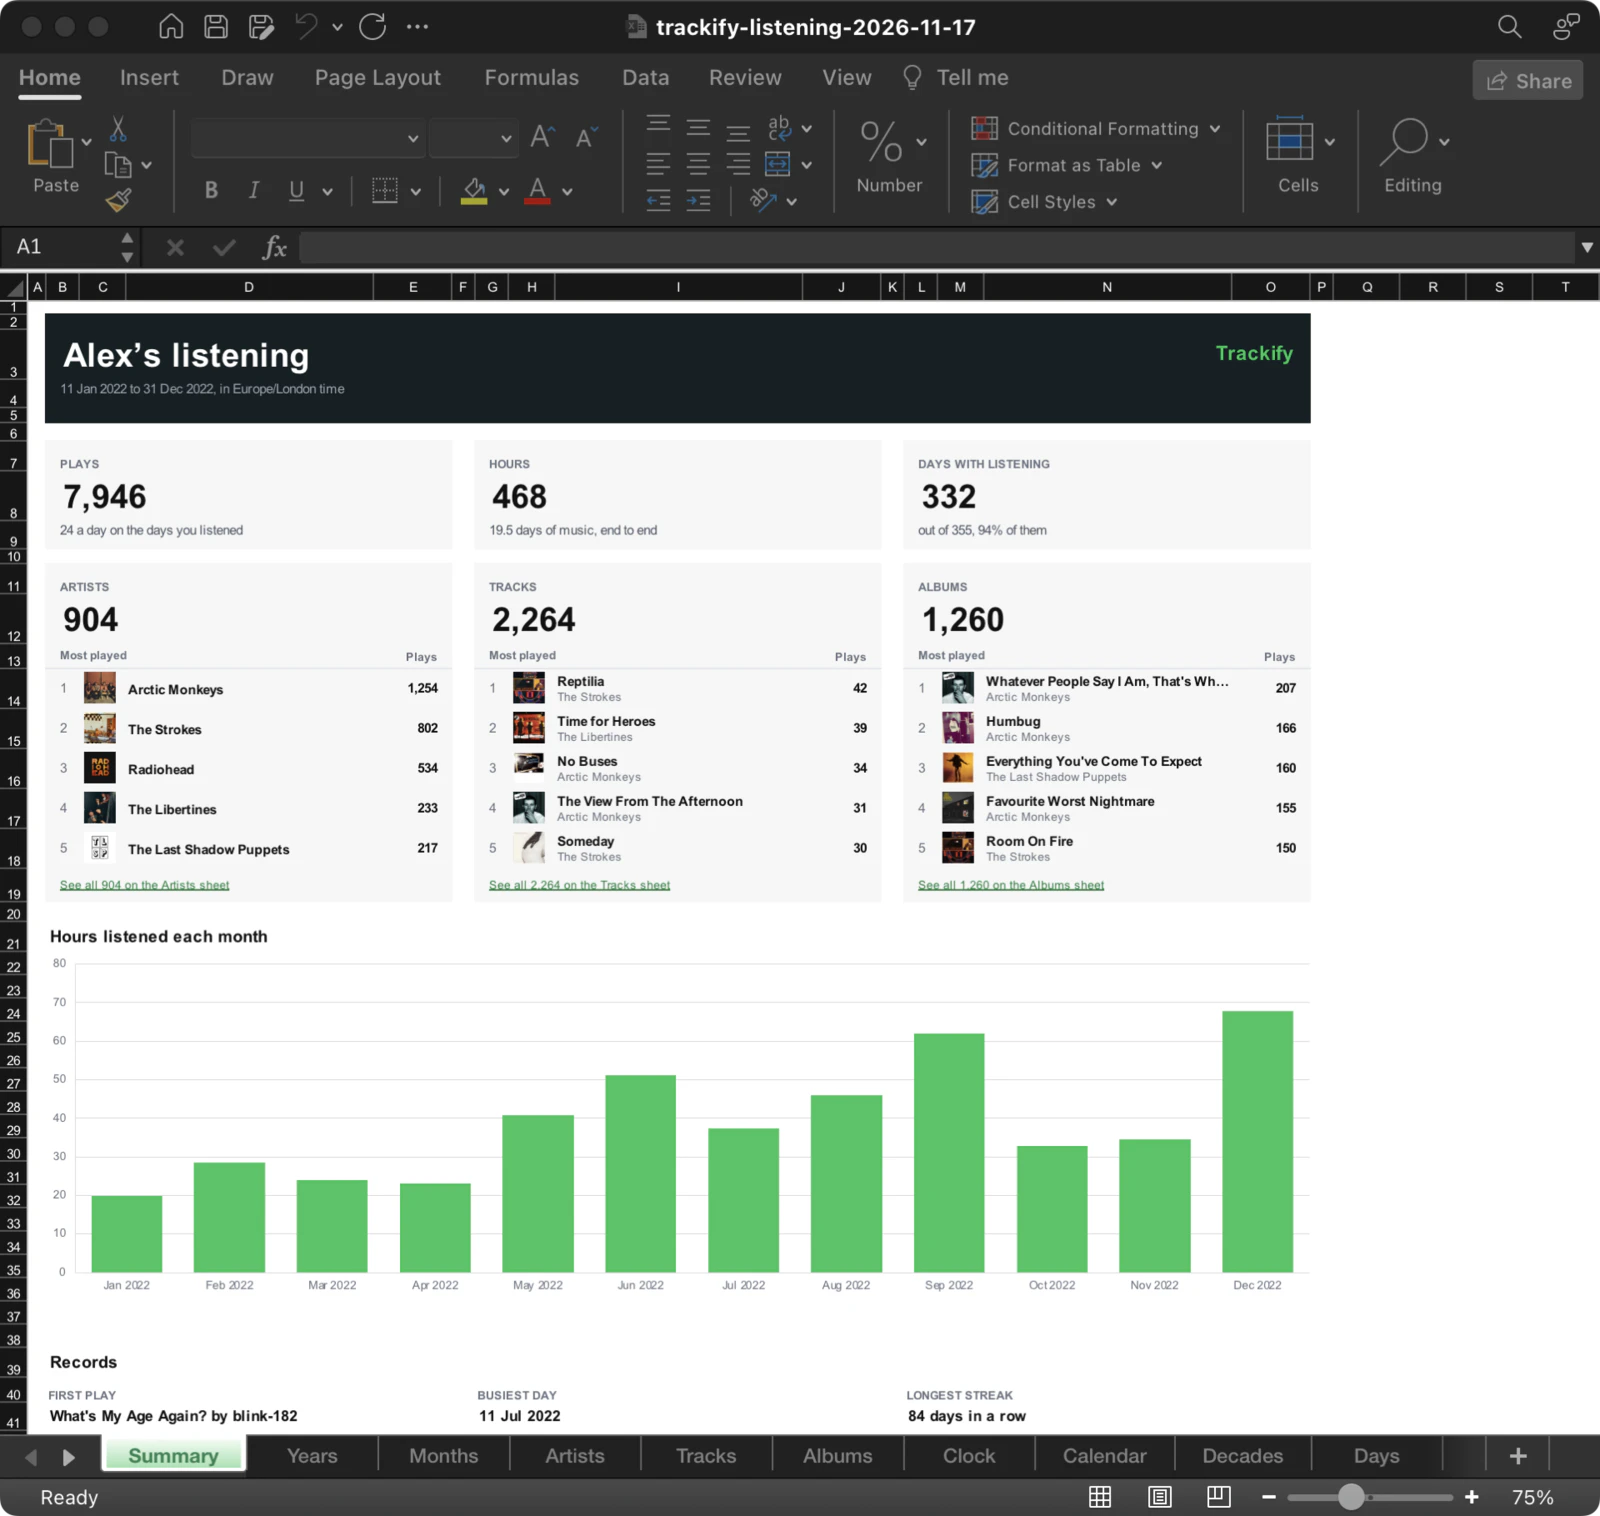
Trackify Plus can hand you your listening as an Excel workbook: one file with your totals, your most played artists, tracks and albums, charts, a calendar of every day and a clock of every hour, already worked out and laid out. You open it and look, the way you would open a report.
The workbook is the summary. If you want a row for every single listen, to work on yourself, that is the CSV or JSON file: see Your export file.
Getting it
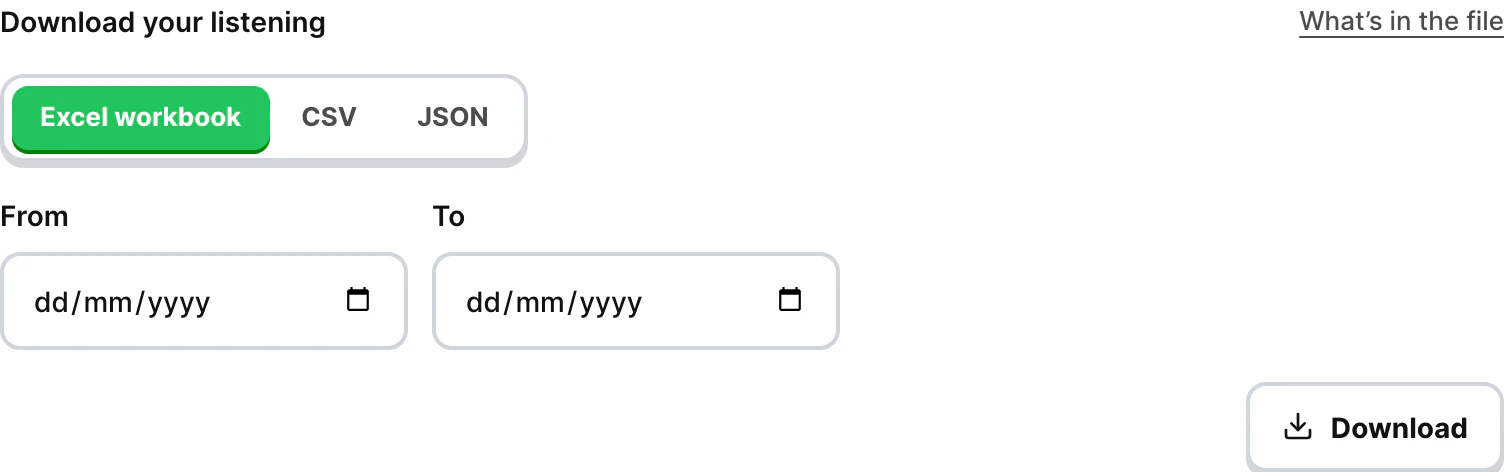
- On the new Trackify, open Settings → Listening history → Download your listening.
- Leave Excel workbook selected.
- To cover only part of your history, set From and To (both days included, in your own time zone). A workbook of one year, or of one summer, is a good thing to make.
- Press Download. A file named like
trackify-listening-2026-11-17.xlsxarrives a few seconds later.
The file is made when you ask for it and Trackify does not keep a copy. You can download up to 10 exports a day, one at a time.
A tour of the sheets
The workbook has a tab for each way of looking at your listening. Everything in it is ordinary spreadsheet content, so you can sort it, copy it, restyle it and build on it.
Summary
The front page. Under the banner with the days the workbook covers:
- Plays, hours and days with listening, each with a line that puts the number in proportion.
- Artists, tracks and albums: how many different ones you played, and the five you played most, with their pictures. The line under each list jumps to the full sheet.
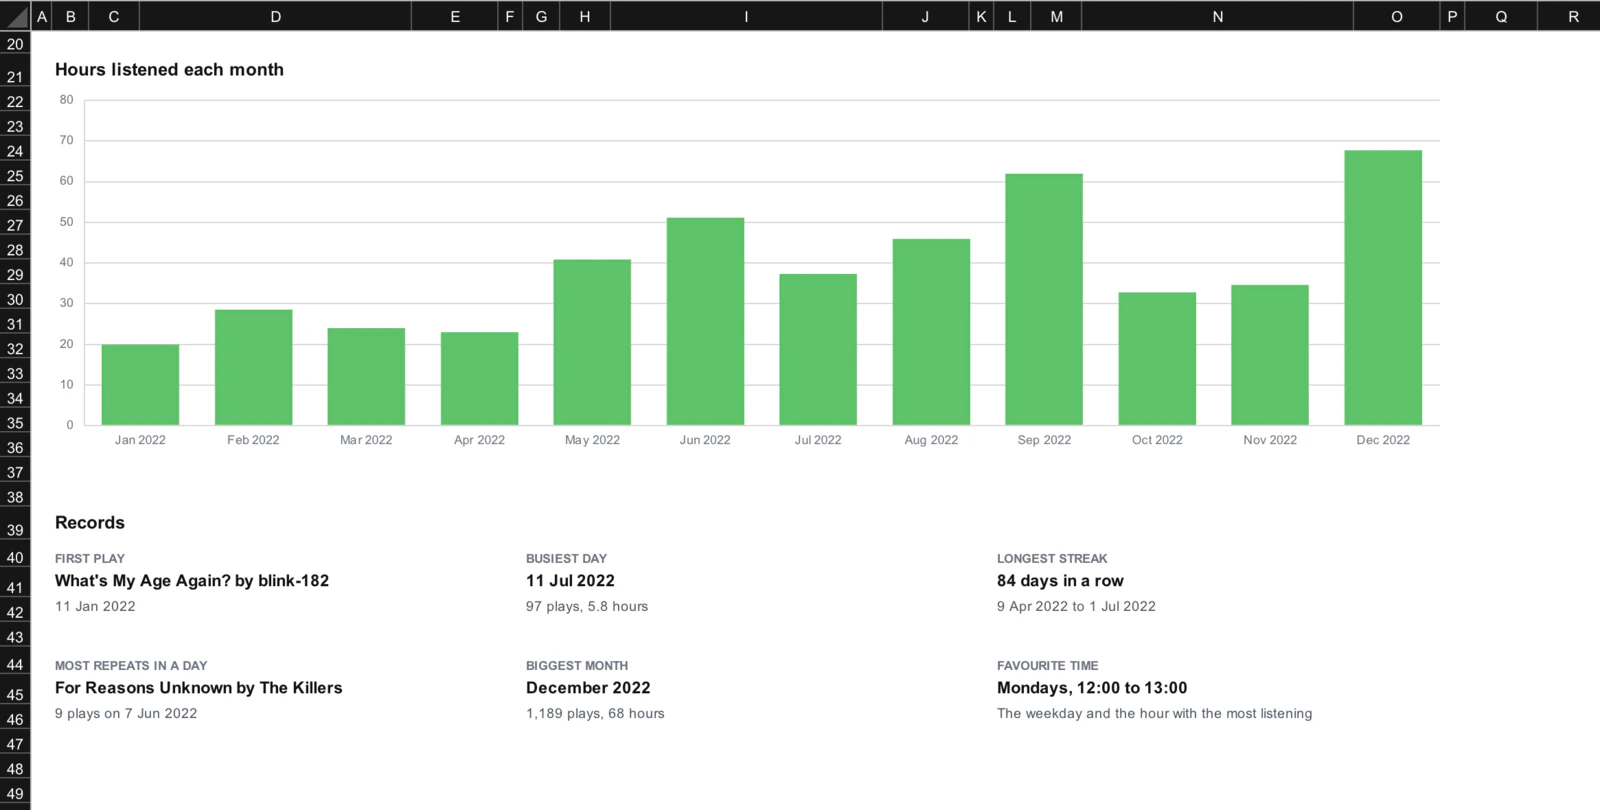
- Hours listened each month, as a chart.
- Records: your first play, your busiest day, your longest run of days in a row, the most times you played one track in a day, your biggest month, and the weekday and hour you listen most.
Artists, Tracks and Albums
Every artist, track and album you have played, most played first, with plays, hours, and the days you first and last played each one. The Artists sheet has a chart of your top fifteen beside it. The first 2,000 names on each sheet are links that open on Spotify.
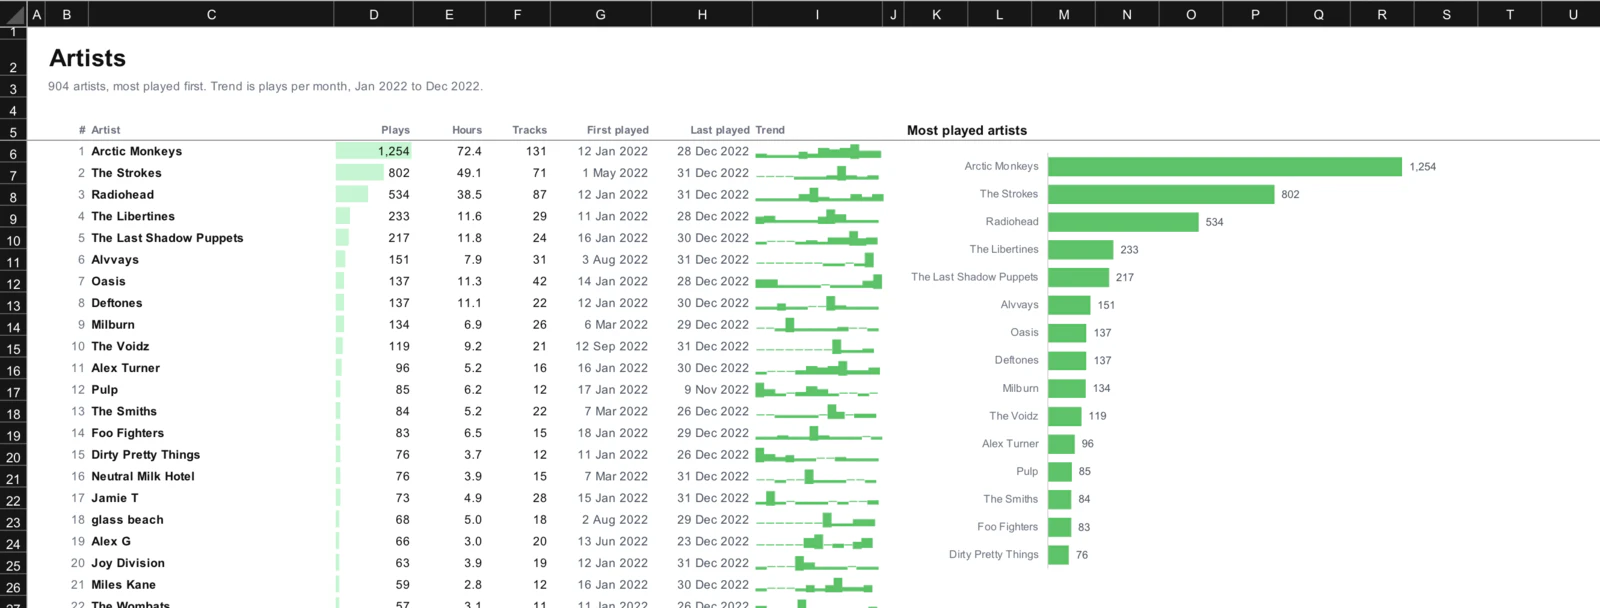
The Trend column is a small chart in every row: one bar per month if the workbook covers up to a year and a half, per quarter up to five years, and per year beyond that. Each row is scaled to its own best step, so it shows when something mattered to you, not how it compares with the row above. A song you wore out in one month and never played again is easy to spot.
Calendar
Every day as a square, a year per block, newest first. The darker the square, the more you listened; a grey square is a day with nothing. The four greens split your listening days into four equal groups, so the darkest squares are your top quarter of days.
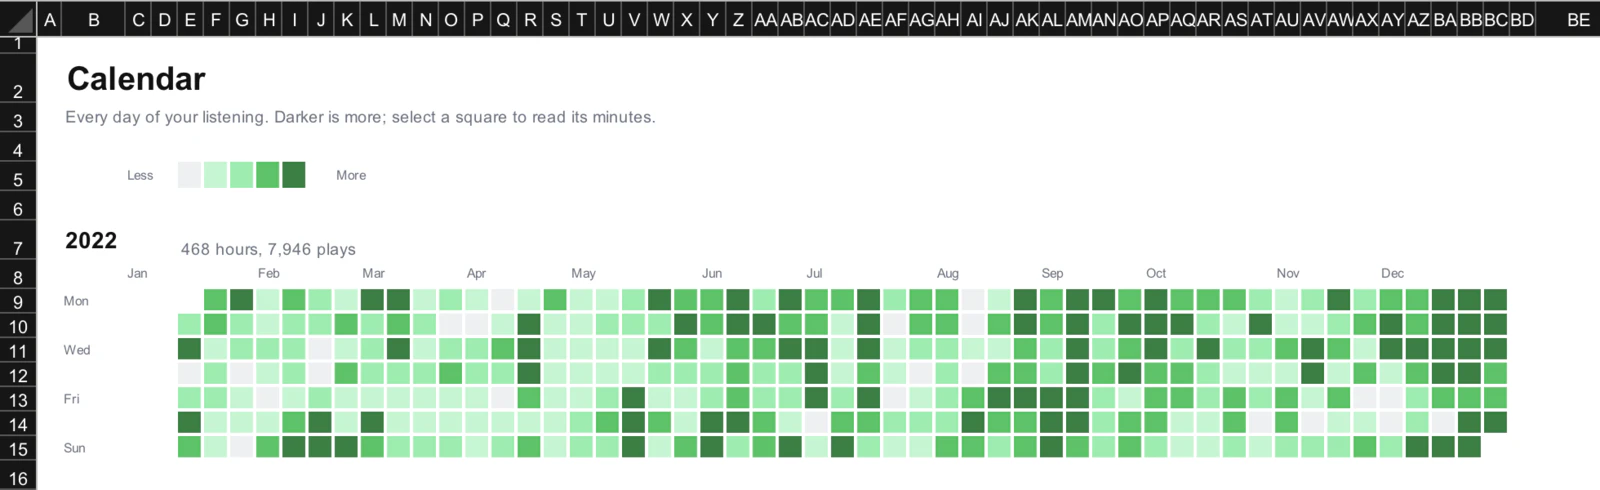
Each square holds its number: select one and the formula bar shows that day's minutes.
Clock
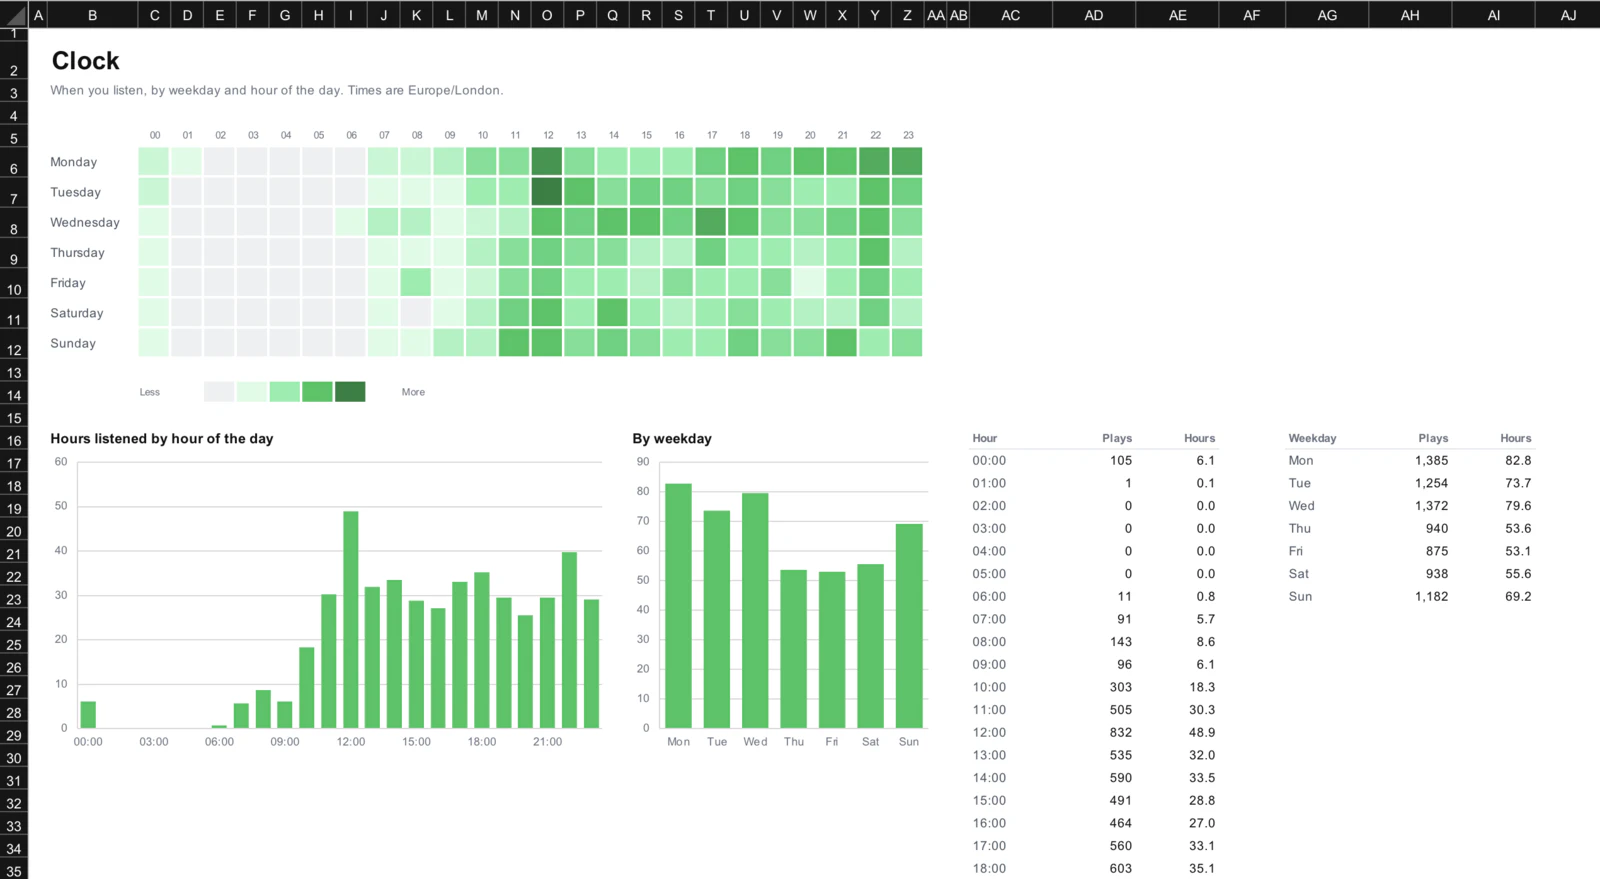
When you listen. The grid has a row per weekday and a column per hour, shaded the same way, and under it are two charts: hours listened by hour of the day, and by weekday. The numbers behind the charts are in the table to their right.
Years and Months
A row per year and a row per month: plays, hours, days with listening, your top artist and top track, and new artists, the artists you heard for the first time in that year or month. Years adds how many different tracks and artists you played and your top album, under a chart of hours per year. Months has a chart of new artists per month, which shows the times you went looking for new music.
Decades
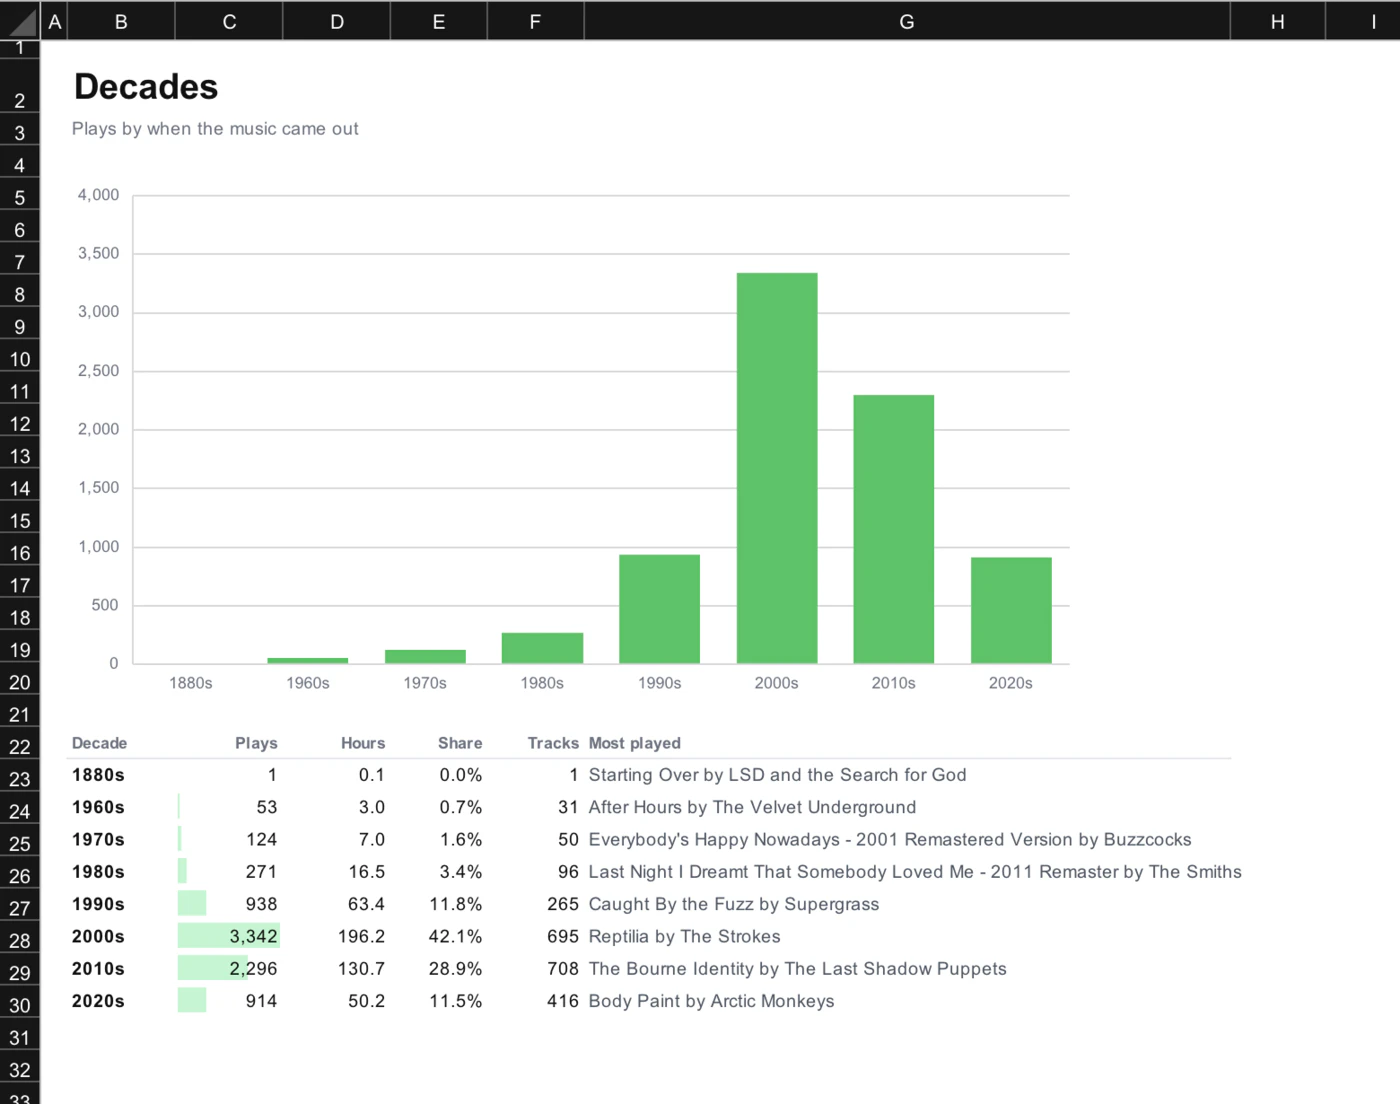
Your plays by the decade the music came out, with the track you played most from each.
Days
A row for every day you listened: the date, the weekday, plays, minutes, and that day's top track and top artist. This is the sheet to build your own charts and pivot tables from.
About
What the workbook covers, when it was made, and how it counts.
How it counts
The workbook counts the way Trackify does, so a number in it is the number you see on the site.
- Plays only. Skips, and listens too short to count as a play, are left out.
- Versions of a song are one track. The single, the album cut and the remaster add up to one row. Re-releases of an album are one album.
- Every credited artist gets the play. A song by two artists counts once for each.
- Hours are the time you listened, not the length of the tracks.
- Days, hours and months are in your time zone, the one saved in your Trackify settings. A song that ends just after midnight belongs to the new day.
If you add up the rows of the CSV or JSON file yourself you can get slightly different counts per track, because that file lists each version of a song under its own Spotify id.
With a date range, everything is worked out inside those days: "first played", new artists, streaks and records all mean within the range.
Things to try
- Sort Tracks by First played. The top of the list is the music your history begins with.
- Turn Days into a pivot table. Select the table, then Insert → PivotTable, and put Weekday in the rows: average minutes by weekday, your quietest month, anything you like.
- Make the charts yours. They are ordinary Excel charts reading the cells beside them. Right-click one to change its type or colours.
- Make one a year. A workbook of each calendar year, side by side, is a good way to see how your listening moved.
Opening it in other programs
The workbook is a standard .xlsx file, made for Excel. Google Sheets (File → Import, or upload it to Drive and open it), Numbers and LibreOffice open it too.
The calendar, the clock and the Trend bars are plain coloured cells and text, so they look the same everywhere. Charts are converted by each program into its own kind and can look a little different, and the shaded bars behind the play counts are an Excel and LibreOffice feature that other programs may leave out. A quick preview of the file (on a phone, or in a mail app) usually shows the tables without the charts and pictures.
Names, pictures and links are Spotify's. The pictures are saved inside the file; the links open on Spotify.